Inventory Growth and Market Balance
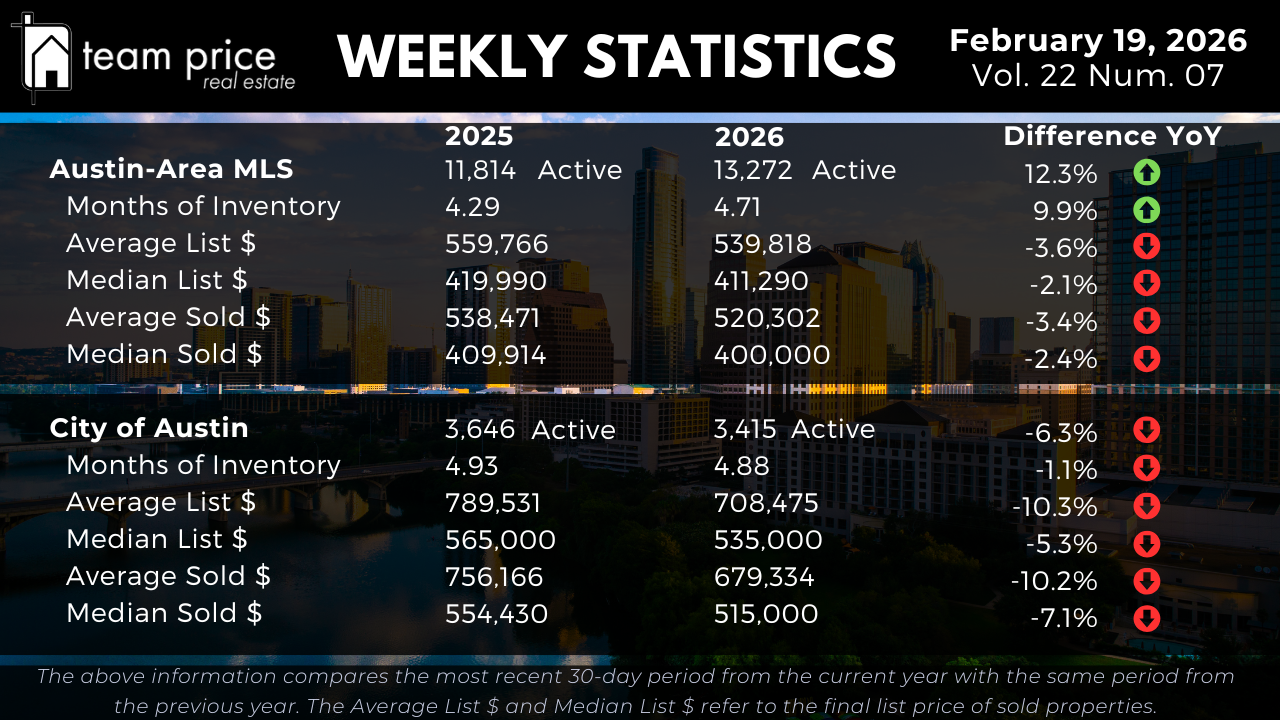
Active residential listings across the Austin-Area MLS now total 13,272, up from 11,814 at the same point last year. That represents a 12.3 percent year over year increase in available supply. Inventory continues to build as new listings enter the market at a pace that exceeds closed sales. Based on current transaction volume, Months of Inventory stands at 4.71, compared to 4.29 one year ago, a 9.9 percent increase. In practical terms, the market is carrying about 1.1 times more supply relative to demand than it was at this time last year. Absorption remains slower than 2025, and inventory has not meaningfully tightened week over week.
Inside the City of Austin, inventory trends differ from the broader metro. Active listings have declined from 3,646 last year to 3,415 today, down 6.3 percent year over year. Months of Inventory has eased slightly from 4.93 to 4.88, a modest 1.1 percent decrease. While supply is somewhat lower than last year inside the city limits, the change is small. The market is not tightening at a pace that would suggest upward pressure on prices. Instead, balance remains steady, with buyers still holding meaningful negotiating leverage.
Pricing Stability Across the MLS
Pricing across the Austin-Area MLS continues to trend lower across both average and median measures. The average active list price has declined from $559,766 last year to $539,818, down 3.6 percent year over year. The median active list price has moved from $419,990 to $411,290, down 2.1 percent. These adjustments indicate that sellers across multiple price points are pricing more conservatively compared to early 2025.
On the sales side, the average sold price has declined from $538,471 to $520,302, down 3.4 percent year over year. The median sold price has moved from $409,914 to $400,000, down 2.4 percent. When both averages and medians move lower together, it confirms that price compression is broad based rather than limited to a specific segment. Week over week, pricing remains relatively stable, but year over year comparisons continue to show measurable softening.
Pricing Trends in the City of Austin
Within the City of Austin, pricing adjustments are more pronounced than the broader metro. The average active list price has declined from $789,531 to $708,475, down 10.3 percent year over year. The median active list price has decreased from $565,000 to $535,000, a 5.3 percent decline. Higher price points inside the urban core are recalibrating more aggressively relative to buyer demand.
Closed sale data shows similar movement. The average sold price has fallen from $756,166 to $679,334, down 10.2 percent year over year. The median sold price has declined from $554,430 to $515,000, a 7.1 percent decrease. These declines exceed those seen across the Austin-Area MLS, indicating that price adjustments inside the city have been more substantial over the past year.
Negotiation and Buyer Leverage
Negotiation remains a defining feature of the Austin housing market. So far this month, 71.58 percent of all closed sales across the Austin-Area MLS have sold below list price, slightly higher than last month’s 70.05 percent. About 18.24 percent have sold at list price, down from 20.41 percent last month. Only 10.18 percent of properties have sold above list price, compared to 9.55 percent last month and 12.08 percent in February 2025.
The average sold to list price ratio stands at 96.77 percent. That means, on average, sellers are accepting roughly three percent below asking price. This confirms that concessions remain common across most segments and that buyers continue to negotiate successfully in today’s environment.
Regional and ZIP Code Variations
Market performance across Central Texas continues to vary at the city and ZIP code level. Among the 30 cities tracked, 18 have recorded month over month price increases, while 11 have declined. Year over year, 14 cities show price increases and 16 show declines. However, when measured from peak levels over the past 12 months, all 30 cities remain below their prior highs. Short term movement exists, but the broader reset from peak values remains intact.
At the ZIP code level, dispersion remains wide. Of the 75 ZIP codes tracked, 39 have recorded month over month price increases and 36 have declined. Year over year, 37 ZIP codes show price increases and 38 show declines. Only one ZIP code is currently above its peak price from the past 12 months, while 74 remain below peak levels. This confirms that while some neighborhoods are stabilizing or improving on a short term basis, the vast majority are still operating below recent highs.
Prices Relative to Peak Levels
Prices across the Austin-Area MLS remain materially below prior market highs. The average list price peaked in March 2023 at $708,929 and is currently around $644,160, down about 9 percent from peak. The median list price peaked in May 2022 at $539,900 and is currently near $436,190, down roughly 19 percent.
The average sold price peaked in May 2022 at $664,515 and is now approximately $541,852, a decline of about 18 percent. The median sold price peaked at $538,000 and is now near $420,000, down roughly 22 percent. On a price per square foot basis, both average and median values remain approximately 25 percent to 26 percent below their 2022 highs.
Within the City of Austin, peak to current declines are also significant. The average sold price peaked at $847,583 in May 2022 and is currently near $674,200, down about 20 percent. The median sold price peaked at $680,000 and is now near $535,000, down roughly 21 percent. Price per square foot metrics inside the city remain roughly 28 percent to 29 percent below peak levels, confirming that valuation adjustments in the urban core remain substantial.
Market Outlook
As February 2026 progresses, the Austin housing market continues to operate in a slower and more measured environment. Inventory across the Austin-Area MLS is higher than last year, Months of Inventory has expanded, and most homes are selling below list price. Both average and median pricing measures are lower year over year, particularly within the City of Austin.
For buyers, this environment offers negotiating power and broader selection. For sellers, accurate pricing and realistic expectations are critical. The data shows a market that is stable but still adjusting. The pace is not collapsing, but it is not accelerating. In today’s Austin real estate market, success depends on aligning price with current absorption levels rather than relying on past peak values.